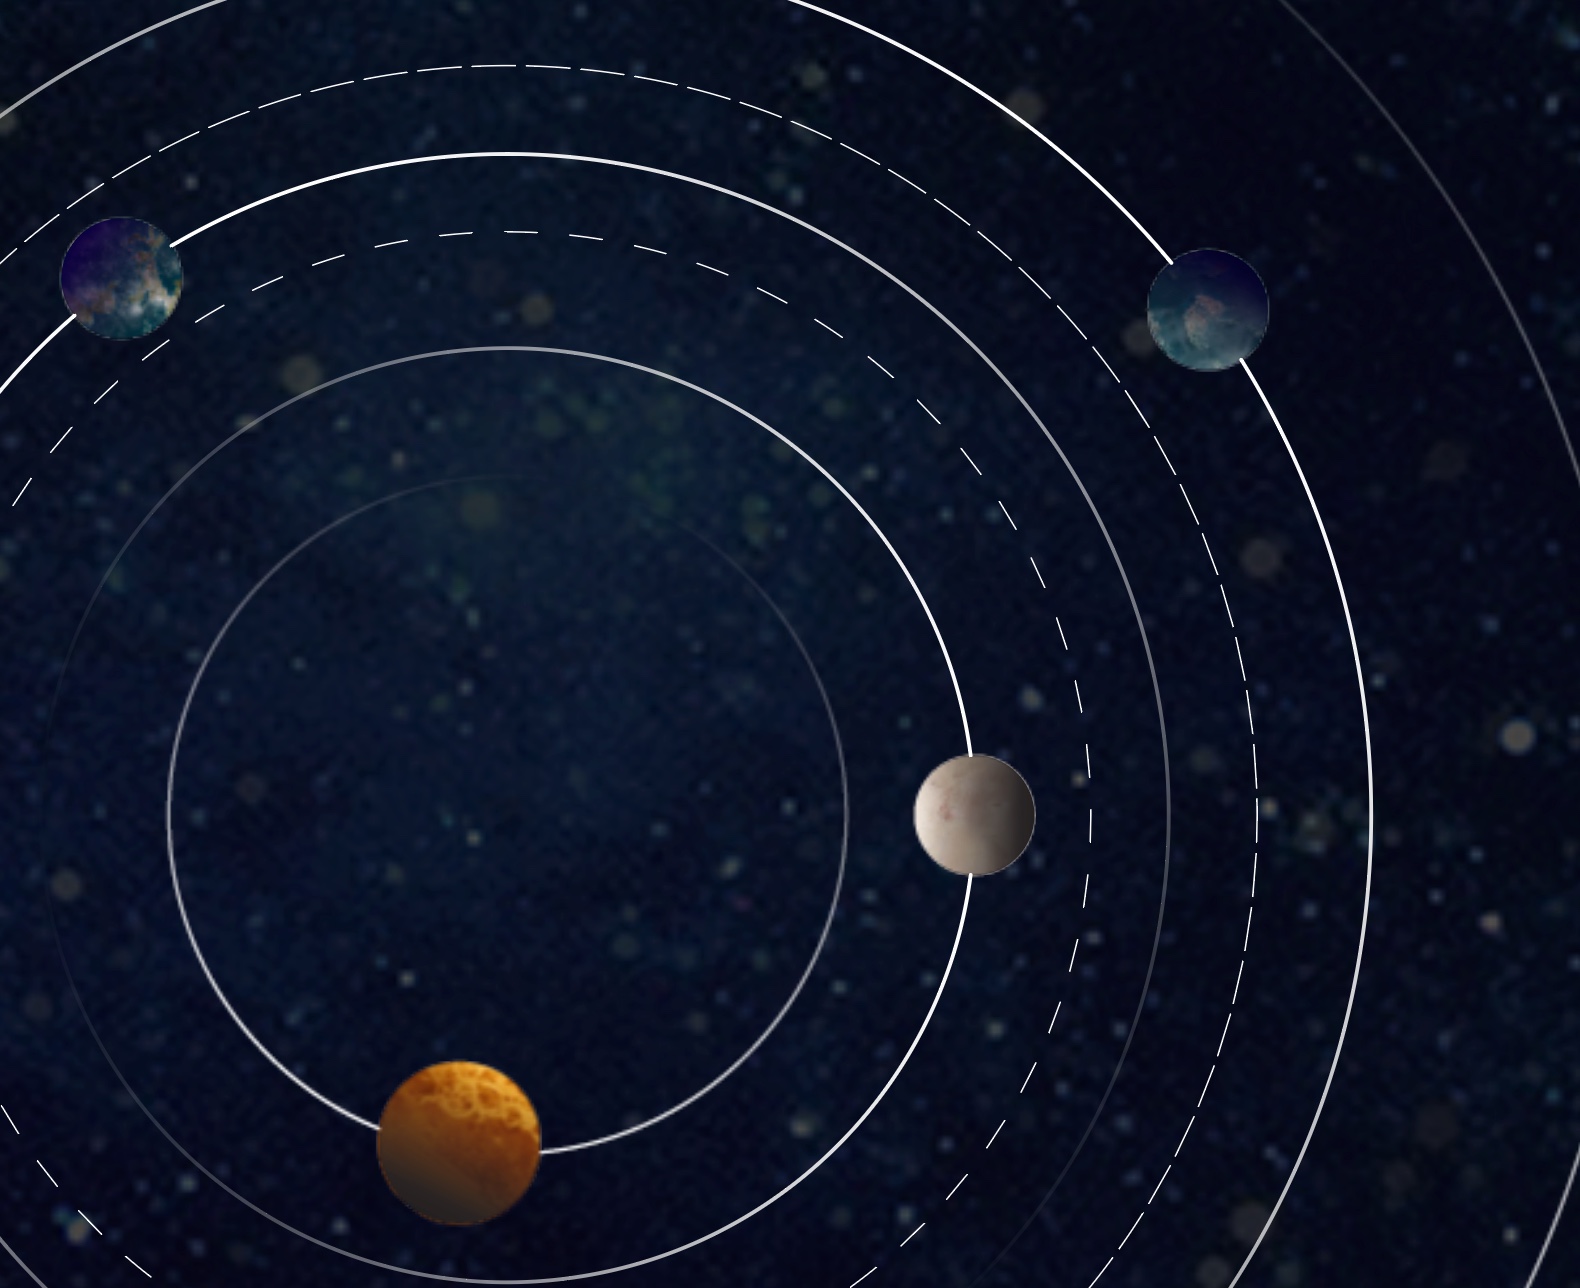
TRAPPIST-1 Orbit Periods
As a nod to the March for Science, here’s a prototype I made of my favorite science thing from the past year: TRAPPIST-1 planets completing their orbital periods around a dwarf star.
The orbital cycles range from 1.5 days to about 20 days, and the distances to their star are much closer than they are in our solar system.
In order to get the precision I wanted from NASA's data as well as the effect I wanted from the graphic design, I ended up starting in CAD software (Rhino 3D) and moving through photoshop, illustrator, and sketch before I got to rigging in Principle App.
Gathering the Data
Since the discovery of the TRAPPIST-1 System was announced, a variety of illustrative diagrams about each planet's radius, orbital period, and distance to Star have been published by NASA / JPL. With a bit of conversion, these diagrams provided enough data I needed to get the planets and their orbits drafted out in Rhino to scale. Unfortunately Rhino doesn't currently have the capability to measure in lightyears, but it's all about ratios.
The TRAPPIST-1 planetary system, based on data about diameters, masses, and distances from the host star (artist's impression) Source: NASA/JPL
Drafting to Scale
After establishing a center, offsetting circles to illustrate the orbits was a quick task. The only assumptions I made were from the original position of the planets relative to one another, so I used an underlay of the "Orbital Separation" graph to take an educated guess.
Deep Space!
Before getting started with the linework, I wanted the background to look galactic. More illustrative than scientifically accurate perhaps, but it adds a good texture. I compiled a couple images together to get to this result, and then adjusted levels / curves / brightness to tone it down.
Bringing in the Orbit Paths
After importing the linework from Rhino to Illustrator as a .dwg, it's time to start formatting. For the orbit paths, the stroke is a bit thicker with a gradient so when they are rotating in the prototype, the movement is a bit more dramatic.
From Dots to Planets
Referring to the NASA illustration for tones, I used a collection of watercolor textures to bring the planets to life. The original circle paths from the drawing were used as boundaries to create clipping masks. To give the impression of spherical geometry, I overlayed a gradient mask on each circle so that their illuminated hemisphere shined a bit brighter.
The Dwarf Star
Whoops! I don't actually have any data behind the size of the dwarf star. But for the effect I want in the visualization, I want more of a glow radiating from the center, from a bright right to a reddish-orange.
Illustrator to Sketch
I only import geometry to Principle by way of Sketch because the images come in a lot sharper. When I brought in the original geometry into Sketch, a lot of my clipping masks and gradients didn't translate between platforms. I ended up duplicating the Illustrator file and rasterizing the layers-- Not ideal, but it helped make a much simpler layer list. To make things easier in Principle, I order and name layers in Sketch first so I know that once I export I can focus my time on rigging.
Animating Rotations
The interaction concept of the prototype is simple– by dragging a slider, the the planets start to rotate around the star, with the main driver being the furthest planet creating a full 360 degree orbit. In order to determine the rate of orbits, I first defined a full 360 orbit on Planet 7 to match the furthest extent of the slider.
Through this relationship, I have defined that Planet 7's 20 day orbital period results in a 360 degree rotation. Planet 6 completes an orbit in 12.35 days. With a bit of algebra I can determine that Planet 6 will have rotated 583 degrees by the time Planet 7 has rotated 360. Applying this logic to the rest of the planets, the model is complete.


